Plot relative Bland-Altman estimates on raw data.
Source:R/create_plots.R
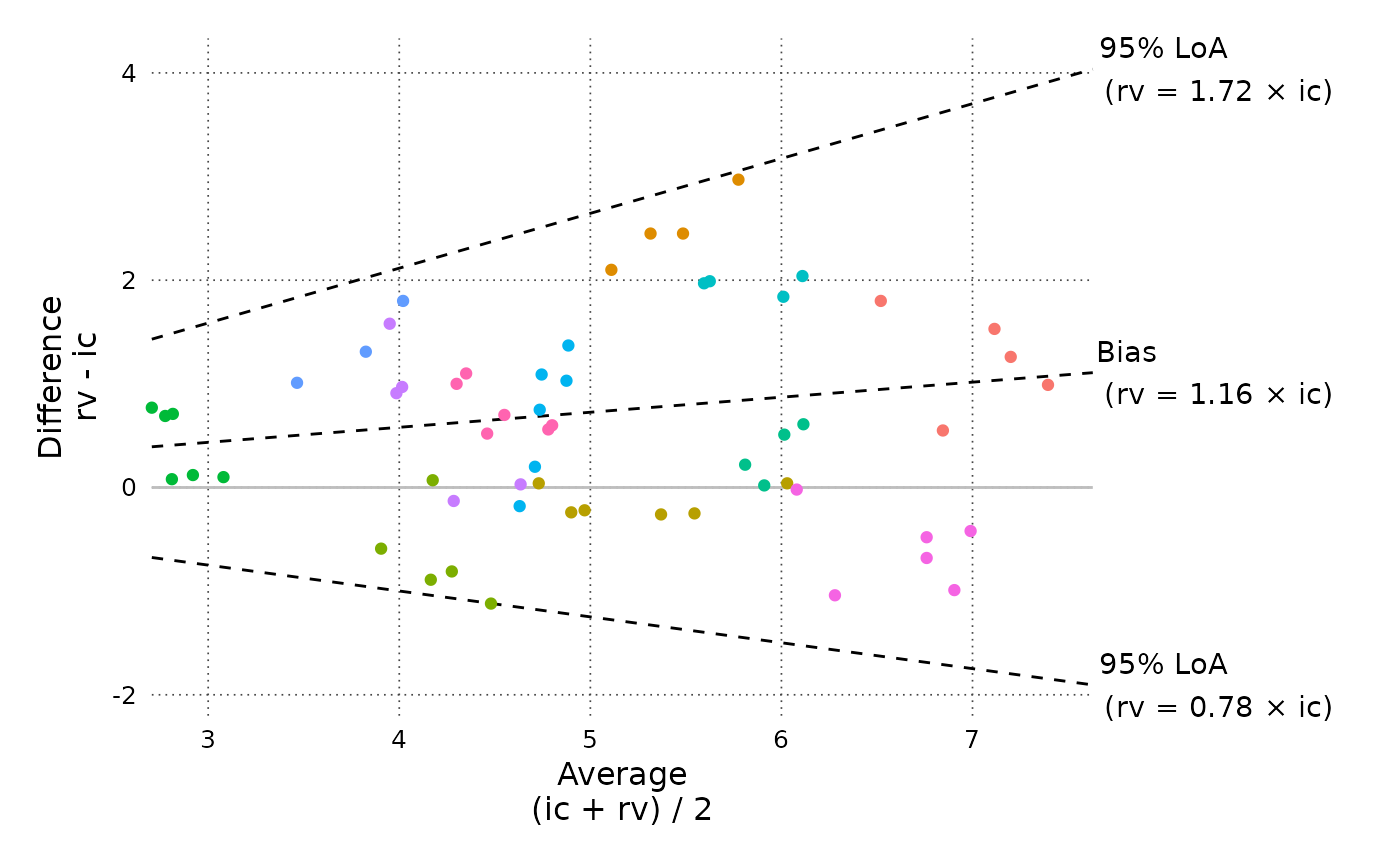
BA_plot_normalized_log.RdVisualizes a Bland-Altman analysis with log-transformed data (showing relative errors) on the non-transformed data.
Arguments
- ba_obj
Bland-Altman analysis object
- show_subject_legend
Show legend for subjects
- aspect_ratio
Set aspect ratio (x/y) between X and Y axis (sets
ggplot2::coord_fixed()), Default (NULL) is automatic.
Examples
BA_CO <- compare_methods(CO, "ic", "rv", id_col = "sub", logtrans = TRUE)
BA_plot_normalized_log(BA_CO)